Markets & research · Beginner · 4 min
Read all eleven sectors
Read the as-of session, one period, and all eleven sector tiles before comparing any two returns.
Last source-verified . Runtime data and availability may vary.
Open this featureLearn
What this lesson is for
Compare sector ETF proxies over a consistent completed-session period.
Access: Public; saving account data requires sign-in.
Before you open it
- A modern browser with JavaScript enabled for interactive controls.
You will be able to
- Compare sector ETF proxies over a consistent completed-session period.
See
Walk through the screen
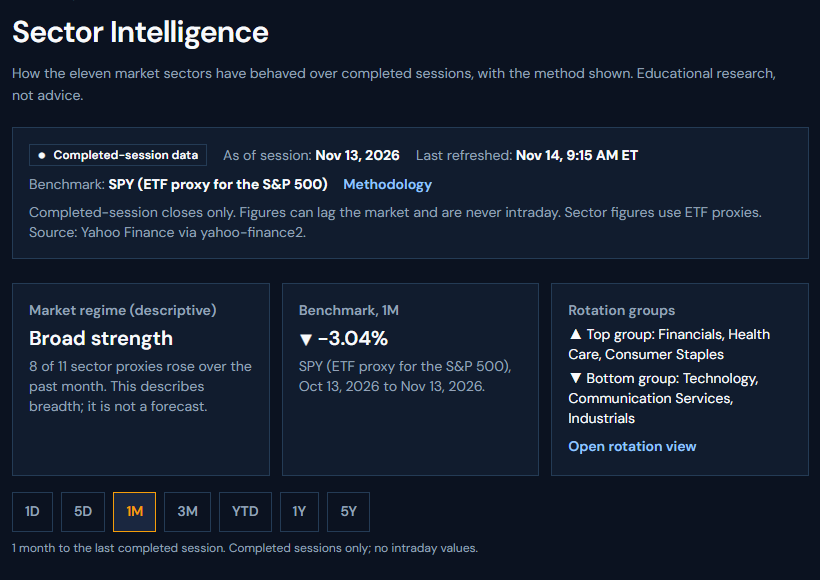
- Completed-session dataThe status says these are completed-session closes, not an intraday quote.
- As of sessionNov 13, 2026 on this capture. A later refresh replaces the date.
- Last refreshedNov 14, 9:15 AM ET. Refresh time is not the market observation date.
- Benchmark and MethodologySPY is the ETF proxy for the S&P 500. Methodology explains the proxies and limits.
- Market regimeBroad strength, because 8 of 11 sector proxies rose. The card says this is not a forecast.
- Benchmark, 1MSPY showed −3.04% from Oct 13, 2026 to Nov 13, 2026.
- Rotation groupsTop: Financials, Health Care, Consumer Staples. Bottom: Technology, Communication Services, Industrials.
- Period control1D, 5D, 1M, 3M, YTD, 1Y, and 5Y. 1M is selected. Keep one period while you compare sectors.
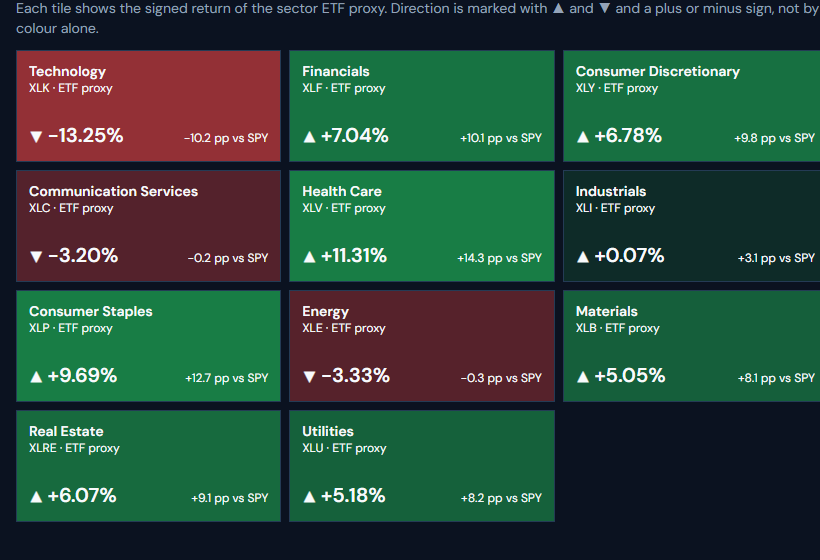
- Signed returnEach tile prints a plus or minus and an arrow. Direction is not carried by colour alone.
- Versus SPYThe smaller figure is the percentage-point gap versus SPY for the same period.
- TechnologyXLK showed −13.25%, printed as −10.2 percentage points versus SPY.
- Health CareXLV showed +11.31%, printed as +14.3 percentage points versus SPY.
- All eleven tilesTechnology, Financials, Consumer Discretionary, Communication Services, Health Care, Industrials, Consumer Staples, Energy, Materials, Real Estate, and Utilities.
Open Markets → Sector Intelligence.
Read As of session, Last refreshed, Benchmark, and the data-status notice before comparing numbers.
Select a period in the Period controls; keep the same period when comparing sectors.
Open a sector tile or its ranked mobile row to inspect the sector detail and its disclosed holdings.
Open Methodology to check ETF proxies, return conventions, data-quality gates, and score limitations.
Try
Worked example
1M view captured on 2026-11-14. The as-of session is Nov 13, 2026, covering Oct 13, 2026 to Nov 13, 2026. A later refresh replaces every figure. These are not current values.
| Period | 1M, selected on the period control |
|---|---|
| SPY | −3.04% from Oct 13, 2026 to Nov 13, 2026 |
| Technology (XLK) | −13.25%, printed as −10.2 percentage points versus SPY |
| Health Care (XLV) | +11.31%, printed as +14.3 percentage points versus SPY |
| Regime card | Broad strength, because 8 of 11 sector proxies rose |
Check the result
- Printed-return comparison. 11.31 − (−13.25) = 24.56 percentage points. That is your comparison of the two printed 1M returns. It is not a separate official statistic, and it is not a forecast.
Full capture note
On the captured 1M view, the as-of session was Nov 13, 2026. SPY showed -3.04% from Oct 13, 2026 to Nov 13, 2026. Technology (XLK) showed -13.25%, which the tile printed as -10.2 percentage points versus SPY. Health Care (XLV) showed +11.31%, printed as +14.3 percentage points versus SPY. The regime card said Broad strength because 8 of 11 sector proxies rose. A later refresh replaces every one of these figures.
Your task
Record the observation date, period, and benchmark for two sectors before comparing their returns.
Verify
Expected result
Read the signed return on the tile and the percentage-point gap versus SPY beside it. Health Care's displayed 1M return was 24.56 percentage points above Technology's displayed 1M return (11.31 minus -13.25). That subtraction is your comparison of the two printed returns. It is not a separate official statistic, and it is not a forecast.
Common mistakes
- If data is stale or unavailable, read the notice and avoid substituting the refresh time for the market observation date.
- On mobile, the heatmap becomes a ranked list.
Progress is anonymous and local to this browser. It does not sync with your account.