
Tools & calculators · Intermediate · 4 min
Build and simulate a strategy
Read a template's legs and the position summary, then leave without saving unless the ticket is one you mean to keep.
Last source-verified . Runtime data and availability may vary.
Open this featureLearn
What this lesson is for
Inspect signed legs, risk limits, and model outputs before saving anything.
Access: Sign-in required. Complete the experience question on Welcome before using the builder.
Before you open it
- A modern browser with JavaScript enabled for interactive controls.
You will be able to
- Inspect signed legs, risk limits, and model outputs before saving anything.
See
Walk through the screen
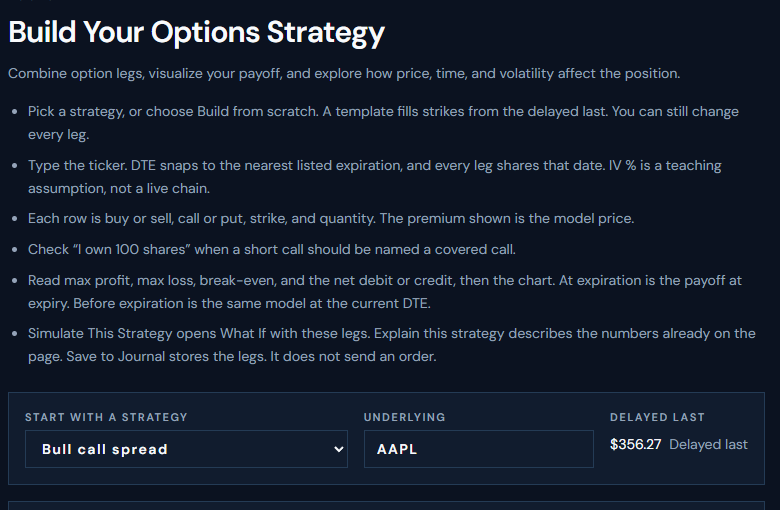
- Start with a strategyBull call spread is selected. Build from scratch is one of the other choices in this menu.
- UnderlyingAAPL. A template fills strikes from the delayed last. You can still change every leg.
- Delayed last$356.27 on this capture. It is a delayed last, not a live chain.
- Page instructionsDTE snaps to the nearest listed expiration. IV % is a teaching assumption. Simulate This Strategy opens What If. Save to Journal stores legs and does not send an order.
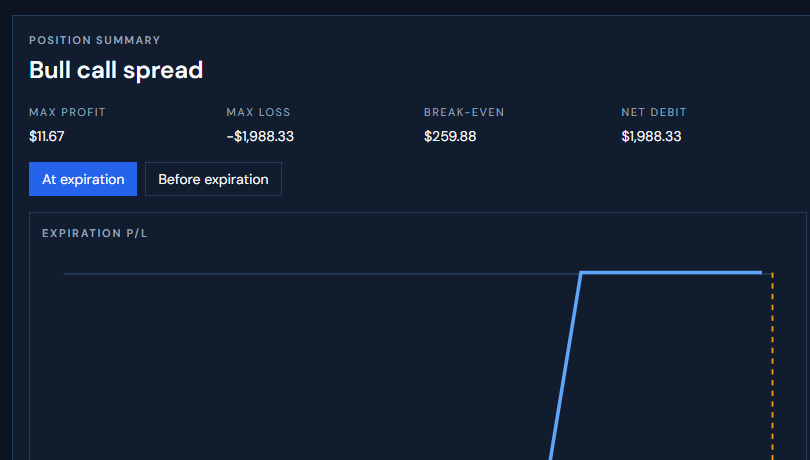
- Position summaryThe page named this structure Bull call spread.
- Max profit$11.67 on this capture.
- Max loss−$1,988.33, the same size as the net debit.
- Break-even$259.88.
- Net debit$1,988.33.
- At expirationSelected. Before expiration switches the chart to the same model at the current DTE.
Open Strategy builder and choose a template or Build from scratch.
Type the ticker and inspect the selected expiration. DTE snaps to the nearest listed expiration; IV % is a teaching assumption.
Check each leg's Buy or Sell, Call or Put, Strike, and Quantity. Check I own 100 shares only when that assumption is true.
Read Max profit, Max loss, Break-even, net debit or credit, and both expiration and pre-expiration views.
Select Simulate This Strategy to open What If with the legs. Explain this strategy narrates calculated values.
Use Save to Journal only after verifying the ticket; it stores legs and never submits an order.
Try
Worked example
Model summary captured on 2026-11-14 after the Welcome question. Nothing was saved. These are the page's model outputs, not a broker fill and not a forecast.
| Underlying and delayed last | AAPL, $356.27 |
|---|---|
| DTE | 45, snapped to the listed expiration Dec 31, 2026 (47 days) |
| IV % | 25, a teaching assumption |
| Buy call | Strike 240, quantity 1, model premium $117.66 |
| Sell call | Strike 260, quantity 1, model premium $97.77 |
| Position summary | Max profit $11.67, max loss −$1,988.33, break-even $259.88, net debit $1,988.33 |
Check the result
- Strike width. (260 − 240) × 100 = $2,000.
- Max profit $11.67. $2,000 − the $1,988.33 debit = $11.67.
- Break-even $259.88. 240 + the $19.883 net debit per share = 259.883, which the page printed as $259.88.
- Max loss. −$1,988.33, the same size as the net debit.
Full capture note
Captured on 2026-11-14 after the Welcome question: AAPL, delayed last $356.27, DTE 45 snapped to the listed expiration Dec 31, 2026 (47 days), IV 25%. The Bull call spread template filled Buy call strike 240 quantity 1 at a model premium of $117.66 and Sell call strike 260 quantity 1 at a model premium of $97.77. Nothing was saved.
Your task
Build a two-leg structure, verify the long and short sides, and inspect its downside before simulating it.
Verify
Expected result
The position summary read Bull call spread, Max profit $11.67, Max loss -$1,988.33, Break-even $259.88, and Net debit $1,988.33. The $20 strike width times 100 is $2,000; $2,000 minus the $1,988.33 debit is the $11.67 max profit. Break-even $259.88 is the 240 strike plus the $19.883 net debit per share. These are the page's model outputs, not a broker fill and not a forecast.
Common mistakes
- Enter valid strikes and a delayed last if the payoff is absent.
- Check every leg when a structure is unrecognized; saving does not correct an invalid intended trade.
Progress is anonymous and local to this browser. It does not sync with your account.